The dumbest xG model
A couple of months ago, I experimented with building an xG model by fine-tuning an image classifier (CNN) originally trained on ImageNet. I used Statsbomb freeze-frames to generate images and fine-tuned the model on those images. The model managed to learn some of the basic dynamics of goal probability (distance, angle) from simple representations of shots, but performed worse on images containing opposition player locations.
Charles William used a more thoughtful approach when experimenting with using CNNs to derive xG estimates. This approach yielded much better results, and represents a much better starting point for anyone wanting to pursue these ideas seriously.
Nonetheless, I had some fun exploring these ideas and I thought it was worth throwing the results up here in case anyone else is interested.
Background
Recently, I’ve been working through the fastai book. The iterative, application-focused style of the book gives it a smooth learning curve, and if you have an interest in deep learning I would happily recommend it.
The fastai approach aims to be pragmatic and falls more on the side of “ML for product development” (as opposed to what I’d call “ML for insight”). In particular, it takes an end-to-end approach to teaching machine learning that frequently leverages transfer learning:
Transfer learning (TL) is a research problem in machine learning (ML) that focuses on storing knowledge gained while solving one problem and applying it to a different but related problem. For example, knowledge gained while learning to recognize cars could apply when trying to recognize trucks.
The book stresses that this can be a good choice for real-world applications and that you don’t need a PhD to achieve excellent (even state-of-the-art) results with creative applications of transfer learning. For example, using image classifiers on spectograms to classify sounds.
This got me thinking - could we use transfer learning to train an xG model?
Motivation
Part of my motivation (the main part) for this project was to try out some elements of the fastai library that I’ve read about in the book.
However, I think there are the kernels of a few ideas that might be interesting, too:
Training on small datasets
I am often asked about xG models by practitioners in under-served areas (for example, lower-leagues). In many cases, people want (or have been asked by their boss) to calculate xG values for their games, where the only data they have is manually coded by themselves.
I’m generally reluctant to advise use of a specific xG model. The dynamics of goal-scoring (and the game more generally) in the Premier League are going to be different to those in the lower leagues. Furthermore, hand-collected data will be very different to that of a major data provider (the major data providers can’t even agree amongst themselves). For these reasons, a model trained on industry-standard top-league data may not generalise well to these domains[1].
But maybe being able to fine-tune a pre-trained xG model on your hand-collected data could be useful?
Sharing and extending models
Similar to above, if xG models had a common interface, then maybe we could share/compare/etc xG models more easily? This would make fine-tuning easier, too. The idiomatic way to do this with fastai seems be to use images as that interface, and so that is what I did.
An alternative solution might be to agree a standard schema for representing shots like the folks at KU Leuven have done with event data and SPADL. However, images do have one advantage as a model input that a more structured input lacks.
Perhaps, using images would enable you to add new features to the images before fine-tuning? Since images are a shared representation of sorts?
Yeah, this makes me cringe a bit, too. But, like I said, kernels of ideas that might be interesting.
Method
At a high level, the method went something like:
- Generate images representing shots
- Train a classifier (fine-tuned resnet34) for whether the shot resulted in a goal or not (xG)
- I ended up training on 4000 shots for this experiment. This strains the “small dataset” point a bit, but I figured I’d see if it worked on a larger dataset, and then see how dataset size affected performance as a second step.
- Test xG on out-of-sample images
The code is on GitHub if you want to give it a spin for yourself.
I experimented with a few image types to feed into the model. For this initial experiment, I thought it would be fun to keep the images as “human-readable” as possible, and ended up with the following:
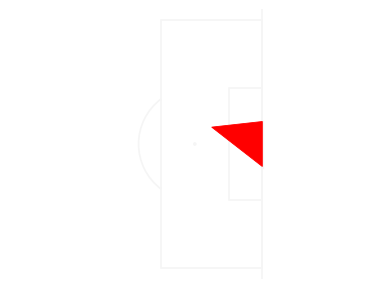
- “Triangle” plot - taking the triangle made between the shot location and the goalposts:
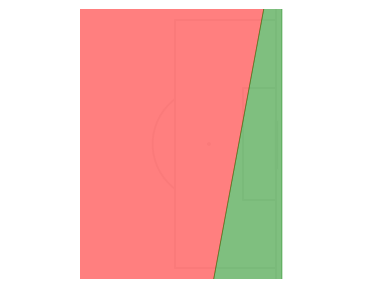
- Minimal voronoi - A voronoi chart using only the goalkeeper and shooter’s location:
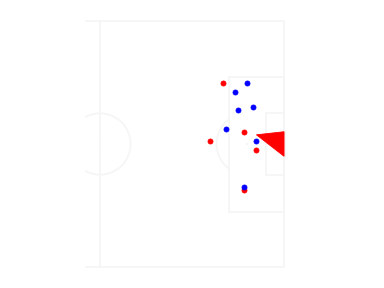
- Basic freeze-frame - a simple pitch-plot with each opposition player and goalkeeper shown as a single point. The shot triangle is overlain as well:
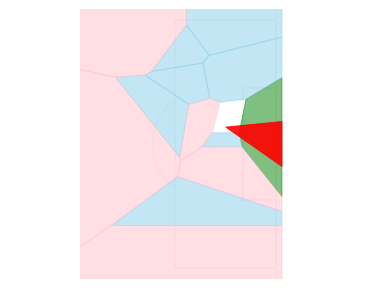
- Voronoi freeze-frame - A voronoi chart using the location of all opposition players and the shooter, with shot triangle overlain:
Results
Root Mean-Squared Error
Let’s look at the Root Mean-Squared Error (RMSE) of the various models. The RMSE is calculated as sqrt(mean( (xG - is_goal)^2 )), where is_goal is 1 for a goal, and 0 for no goal. Lower is better.
The RMSE for each of the image models, an “ensemble” (the average of the xG estimates from the minimal_voronoi and triangle models), and Statsbomb’s own xG is shown below.
I also added a benchmark “model”, which uses the average conversion rate of all shots as its xG estimates. This represents the no-information scenario, which all models should beat.
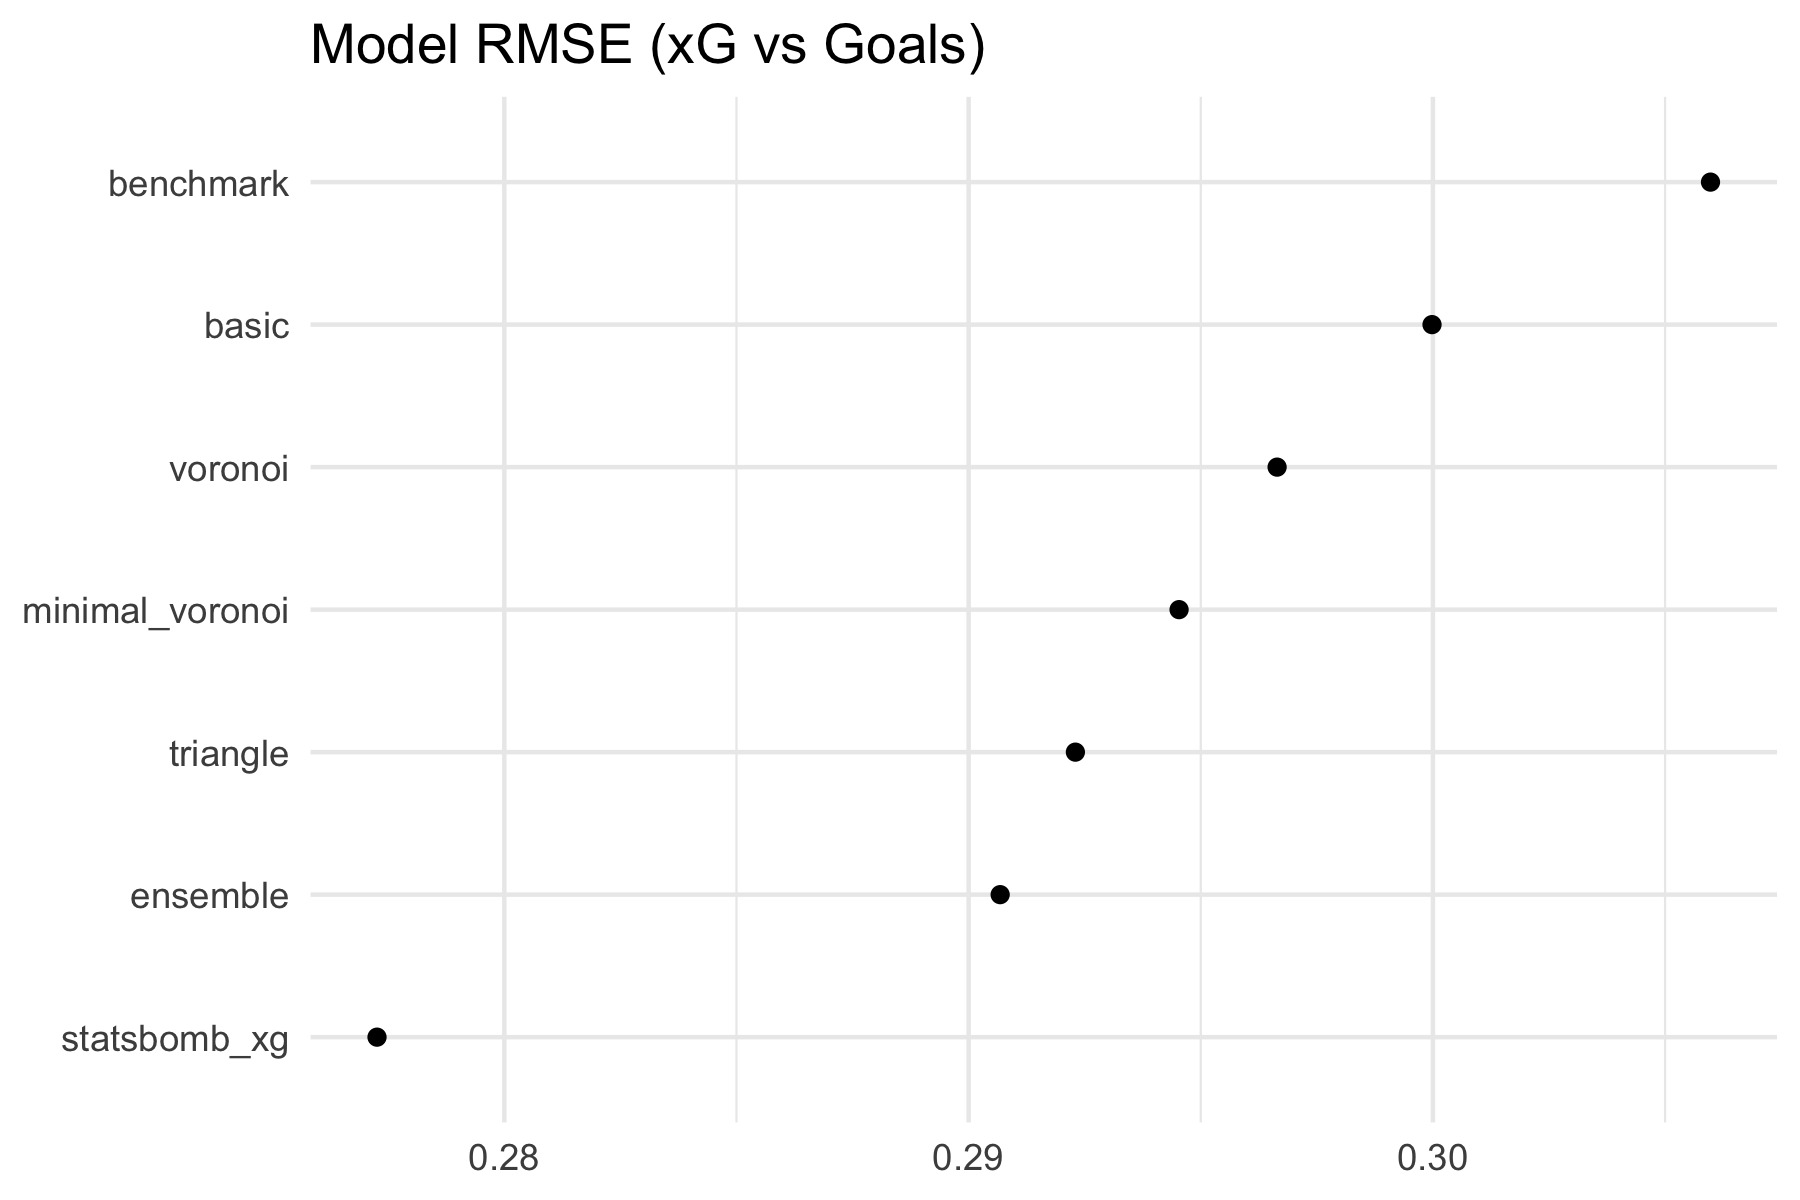
There are a couple of things that jump out immediately:
- All the models do much worse than the Statsbomb xG
- The simpler images (
triangle,minimal_voronoi) performed better than those that used the full freeze-frame data- The more “complex” images were prone to over-fitting on the training data before reaching the accuracy of the simpler models
However, I don’t think the results (for simple models) are terrible. An RMSE of about 0.29 is around the same ballpark as a couple of other models (logistic regression, random forest) that I threw at the same dataset, trained on “simple” (non freeze-frame) features.
Distribution of predictions
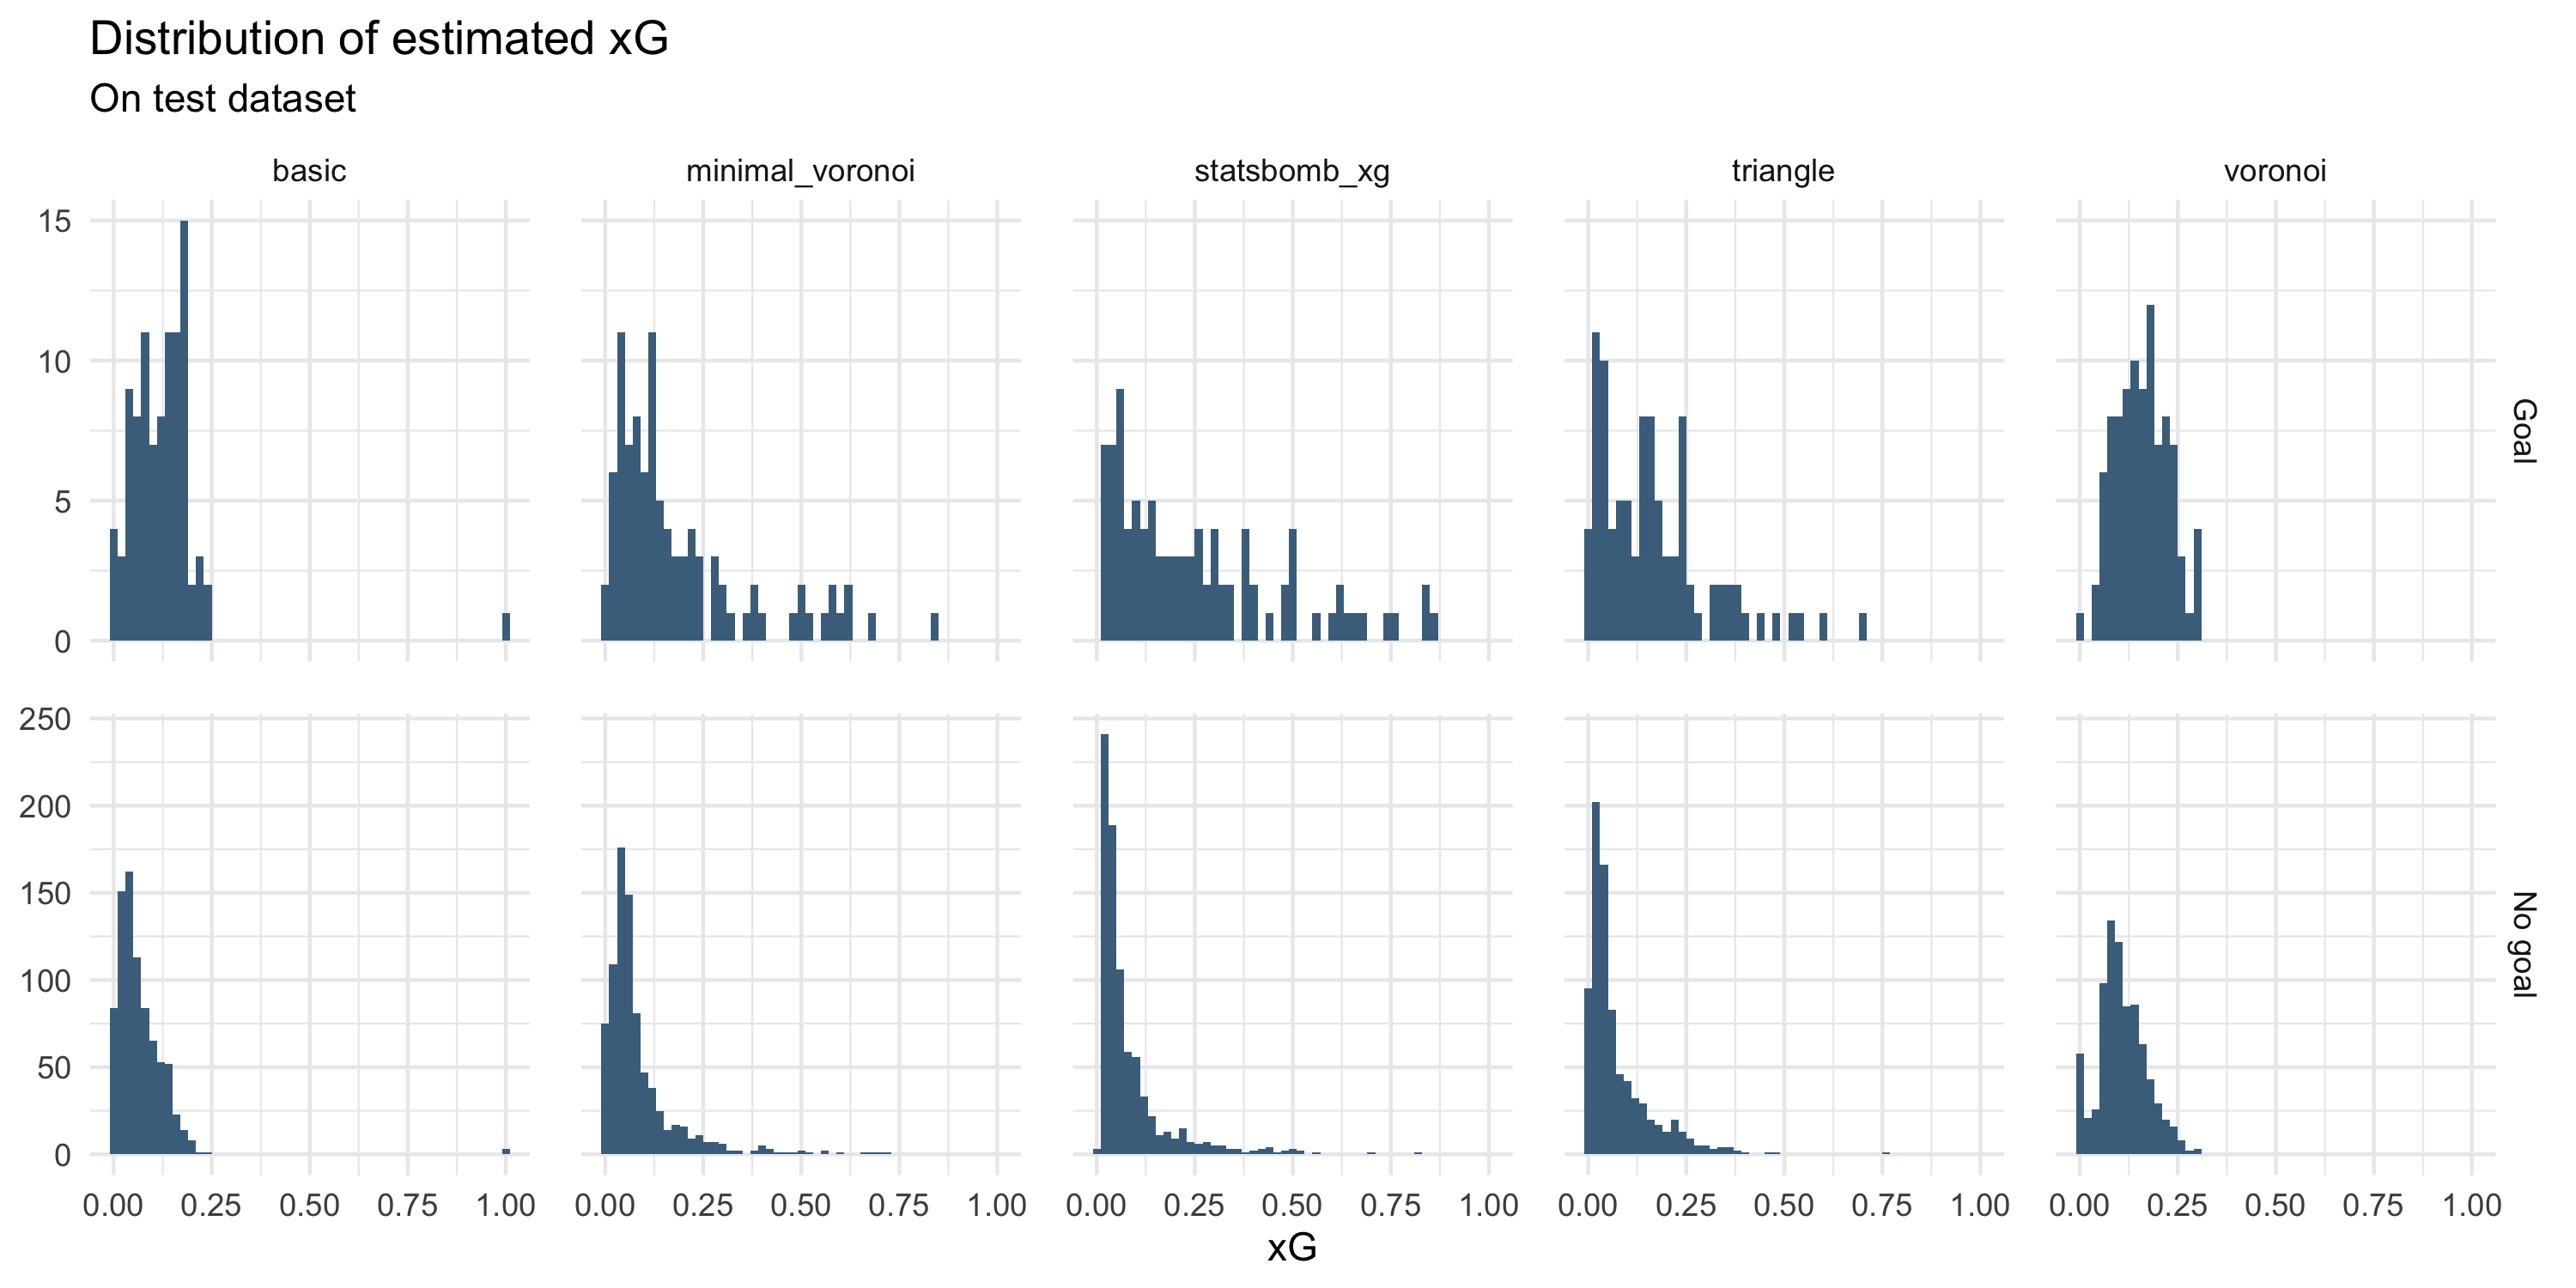
Looking at the distribution of predicted xG, we can see that the “complex” models (basic, voronoi) tend to be much more conservative than the simple models (triangle, minimal_voronoi); they refrain from making very low and very high xG estimates.
Although the simple models are better in this respect, their xG distributions still show some clumping when compared to Statsbomb’s estimates.
For the simple models, I think this is understandable on the grounds that they don’t actually have access to more advanced features. However, it’s disappointing to see from the complex models which could (in theory) pick up on this.
So overall, not great.
Perhaps the clean, geometric nature of the shot images was too different from the type of images it was trained on (imagenet)? Could more idiomatic (i.e. computer-friendly, rather than human-friendly) images help close the gap to Statsbomb’s model?
Further developments
Is it worth taking this idea further? I’m on the fence.
On the one hand, the top-level results for “simple” images are relatively promising. Maybe there’s a better representation of freeze-frames that the model can more effectively learn from?
On the other hand, there are so many practical pitfalls and flaws with this method. Without state-of-the-art results, I don’t see why you’d persist with this over a more reliable, easily explainable method[2]. For serious applications, I think careful, methodical investigations are going to be more appropriate. One such case is Charles William’s work, “Evaluating the Performance of Convolutional Neural Network Based xG Models”.
So I’m not sure. I think I’ll leave it for the time being, but if I might revisit it if I can think of a better way to show the full freeze-frames in image format. It would be fun to get somewhere close to Statsbomb’s error rate with a relatively wacky idea like this.
Code etc
The code for this project is available on GitHub.
I used the cookiecutter data science template for this project. I used this partly out of curiosity, but also in the hope it might make it easier for people to modify or experiment with.
What do you think? let me know.