Tracking team strength over time
In my previous posts, I’ve looked at estimating team strengths from closing odds. In an effort to extract a few more drops of value from the husk of this particular lemon, I’m going to look at how teams’ ratings have evolved over time.[1]
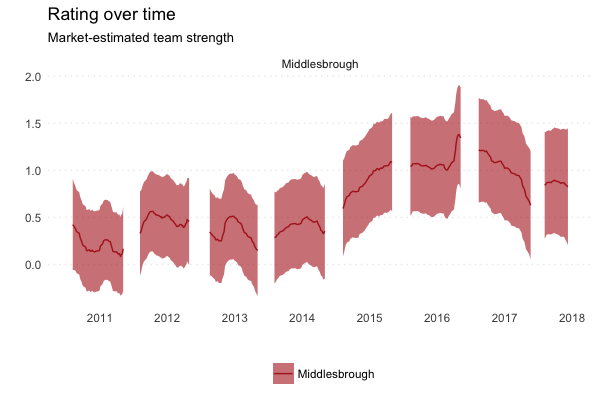
The y-axis (height) shows the team’s rating over time, where zero is the average for teams in that country. In England, this covers the Premier League down to League 2 (inclusive). In other leagues, it covers the top two divisions unless otherwise stated.
In this post, I’m going to look at some of the model’s wrinkles that I think are interesting.
Motivation
Motivation matters a lot, particularly at the end of the season, when there are big differences in motivation (i.e. one side has nothing to play for, the other does). Because the model uses closing odds, this is a signal that it picks up.
Perhaps the clearest example of this is Bayern. They are so dominant in their league that they often have little to play for at the end of the season (and European competition to rest for).
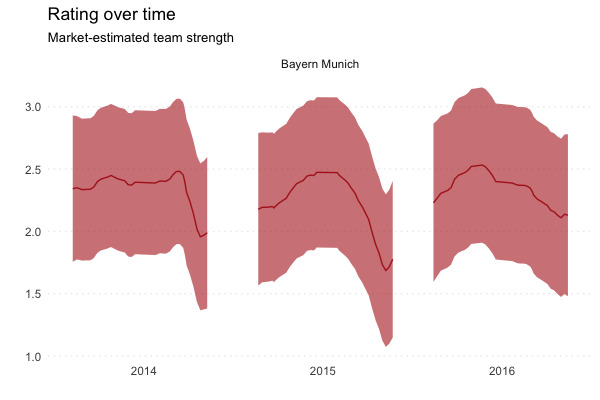
You can see a clear drop off in perceived quality in 2013/14 at the end of the season, once the title has been secured. There is an even more extreme slackening in 2014/15, the year in which Dortmund decided converting chances was boring, removing what little league competition there was by Christmas.
So how much is this difference in motivation actually worth? It’s hard to intuit directly from these ratings alone[2], but we can have a look at the effect on match outcome probabilities.
The average team rating in the Bundesliga and 2. Bundesliga combined is zero. To give you a rough idea, at the start of 2015, the closest team to 0.00 was Werder Bremen (0.04), followed by Freiburg (-0.06). At the time of writing, the closest team is Hannover (-0.01), followed by …er… Freiburg (0.08).
Comparing the estimated outcome probabilities of a 2014/15 Bayern home game against that (hypothetical) average team gives us a better idea of what the effect of motivation is.[3]
| Home | Draw | Away | |
|---|---|---|---|
| Normal motivation | 0.9 | 0.07 | 0.03 |
| Low motivation | 0.8 | 0.13 | 0.07 |
| Difference | -0.1 | 0.05 | 0.04 |
So we get a rough drop in home win % of 10%. This feels like a pretty big effect.
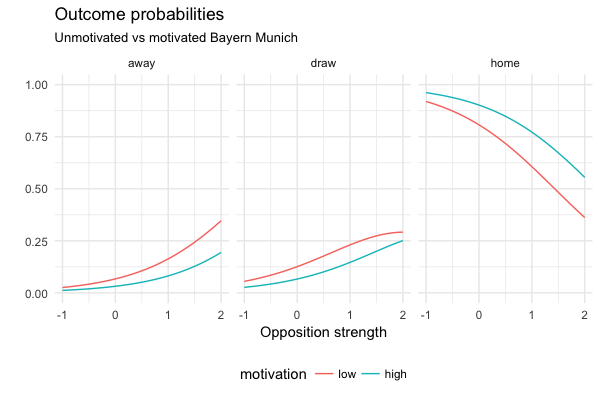
We can generalise this a bit further and look at the outcome probabilities across a range of opposition ratings. For reference, at the end of 2014/15, Dortmund’s rating was about 1.51. At the other end of the scale, we have Fortuna Dusseldorf (-0.76) and Heidenheim (-0.69) from 2. Bundesliga.
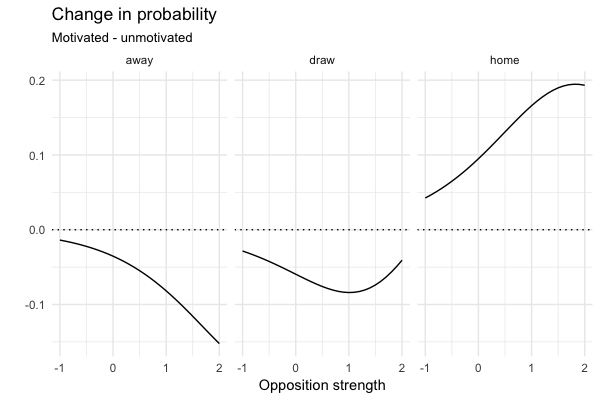
I think this points towards an interesting wrinkle in teams’ schedules. If you’re a relegation-threatened team, you ideally want your end of the season games to be against unmotivated teams, who are of a similar quality to you. This isn’t exactly groundbreaking stuff, I know, but interesting to see in the model and to get (rough) numbers on.
As an aside, it’ll be interesting to see how the market evaluates Man City this season if they win the league but have an unbeaten streak to maintain.
Transfers
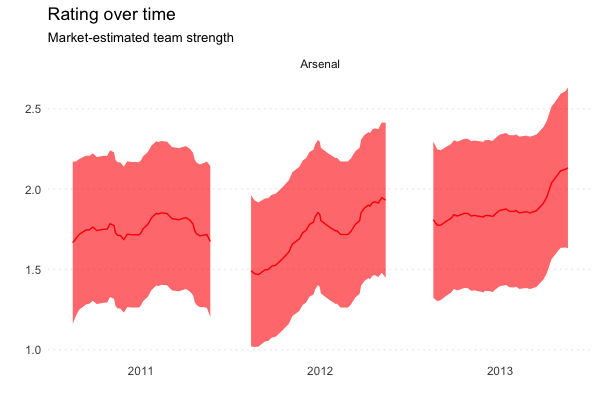
The summer of 2011 was a painful one for Arsenal, losing Fabregas and Nasri. This was reflected in the market, as there is a clear drop between their rating during 2010/11 (1.6-1.7) and the start of 2011/12 (1.5).
The rating’s climb over the course of the season says a lot about that squad’s (over?)performance and the expectations they were given.
I have also left in 2012/13 as a potential example of high motivation boosting a team’s rating, as Arsenal chased down Spurs.
Managers
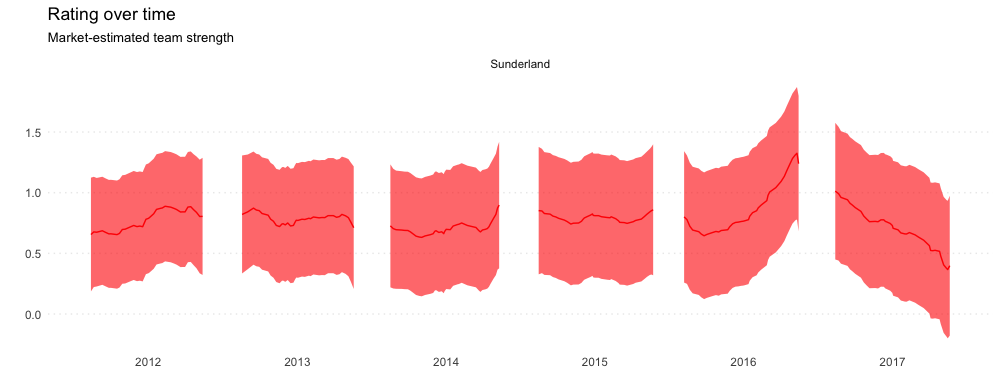
Sunderland somehow managed to perennially circle the bowl before finally getting flushed in 2016/17 with David Moyes. I think it’s interesting to see the team’s rating climb up under Il Grande Sam (appointed 9th October 2015), before being immediately adjusted (and continuing to fall steadily) under Moyes.
Yes, there are going to be some motivation effects in here as well. However, I think the trends under both managers are steadier and last longer than motivation effects we see in teams like Juventus and Bayern. This makes me think that the majority of the effect is driven by the market reacting to real changes in the team’s quality.
Body swaps
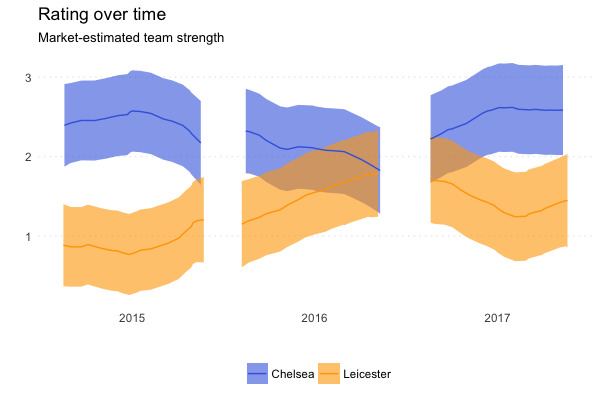
I don’t have anything clever to say here. I just think this one is fun.
There are a couple of different ways to do this. One is to shoehorn a time-decay factor into the likelihood function, as in Dixon-Coles. However, when I tried to do this in Python, I ran into a couple of issues that I think were down to the extremely small numbers being generated during estimation. Instead, I decided to fit a smoother based on how much each team’s rating can vary from game to game. ↩︎
This is a big disadvantage of these ratings. It would be nice to be able to look at them and say something like “This team is ~X GD per game better”. Given the ease with which these ratings are generated and their accuracy, I think this is a fine trade-off, but something to bear in mind. Perhaps it would be nicer to “translate” the abstract team ratings into something more concrete like “P(win) vs average team” when attempting to communicate them. ↩︎
I took normal motivation to be Bayern’s maximum rating in 2014/15 (2.47), and their low motivation to be their minimum rating (1.69) ↩︎