How to estimate team strength from xG totals
I’ve written before about a hack method to use xG values within a Poisson-based match prediction model. This is useful for both predicting matches and understanding football teams’ offensive and defensive strength over time (along with other factors like home advantage). However, to use this method you need to have access to an xG value for every shot within a given match. This kind of data isn’t widely available to the public. Where it is available, it often requires some technical knowledge of web scraping to get at it.
But what is often available is xG totals. They are everywhere.
So, in this post, I’d like to present a method for building a match prediction model using xG totals. This uses data that is much more readily accessible to the average fan, while only sacrificing a little prediction quality.
How does it work?
First, we need to understand how the model using individual shot xG works. You can read in detail on a previous post, but in short:
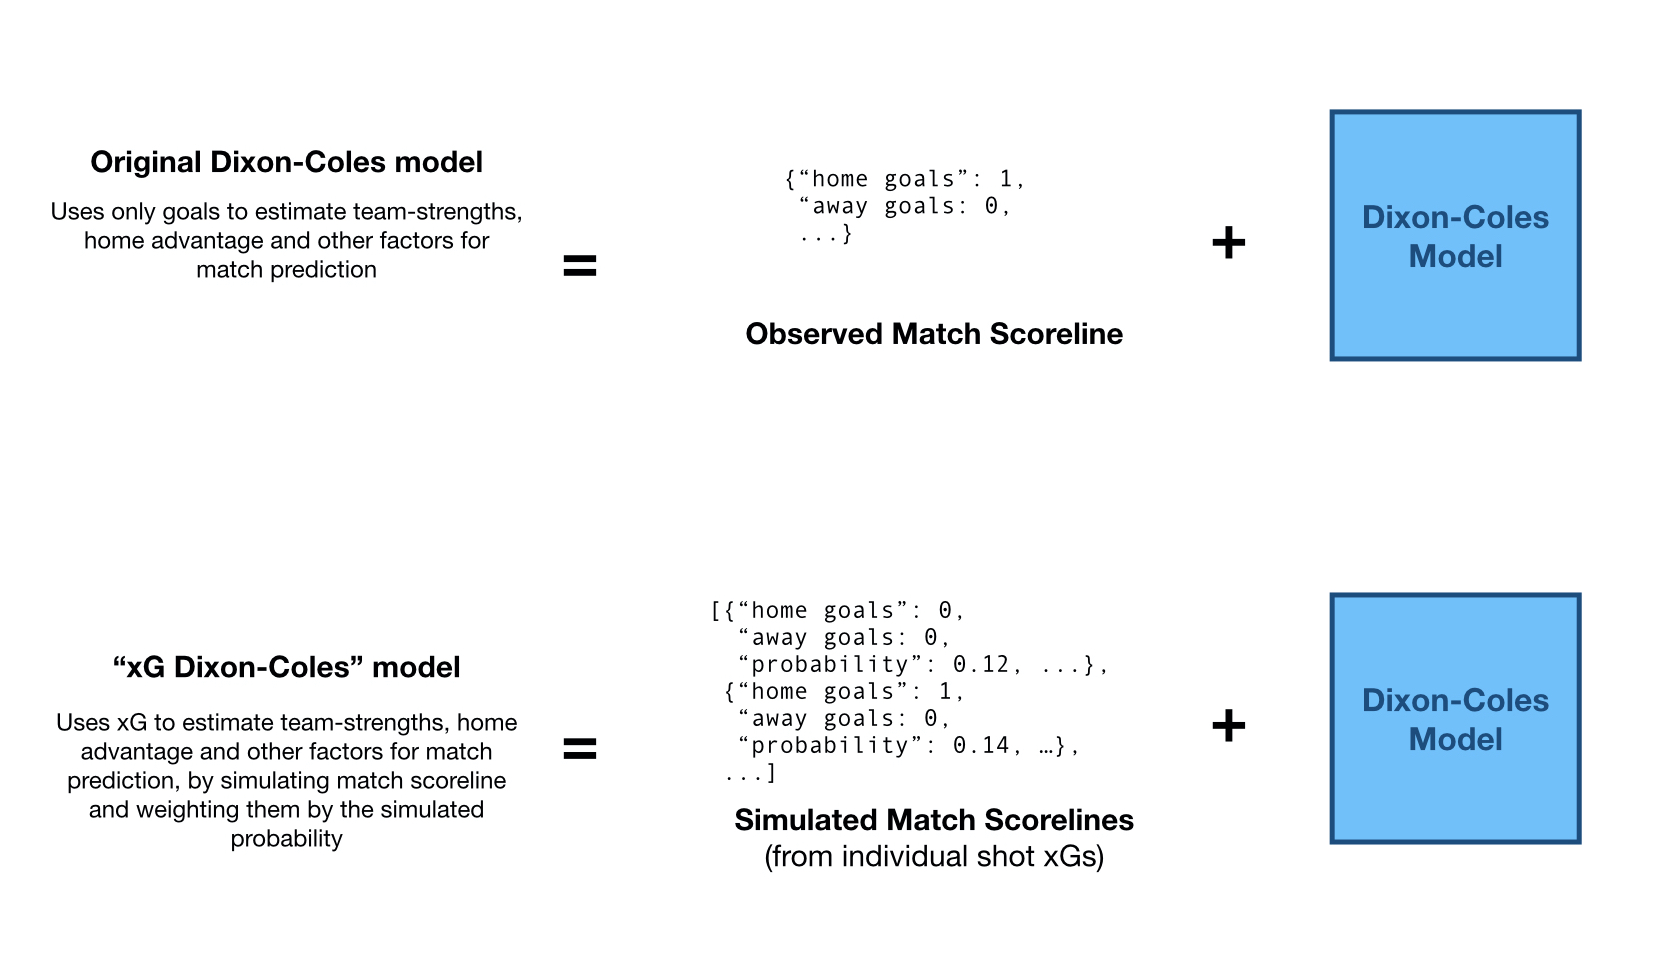
- The original D-C model estimates each team’s offensive and defensive strength, and home advantage from match scorelines
- xG D-C simulates match scorelines using the xG values from each shot in the match (see also)
The key insight here is that we can look at this class of models as the composition of two distinct functions:
- A scoreline generation function
- This is a function that, for each match, will give a list of match scorelines, with weights, for each match
- In the classic case, this just returns the actual match scoreline (with a weight of 1.0)
- In the xG-DC, this returns the simulated match scorelines (with a weight of
probability)
- The Dixon-Coles model fit
We don’t need to be limited to goals, xG or resimulation, or… anything at all, really. All we need is a list of weighted scorelines for each match.[1]
So, to make the model work for xG totals, we just need to find a way to make xG totals into weighted scorelines. I think the simplest way is to look back at the model assumptions.
The basic Dixon-Coles model is, at its heart, a modified Poisson model. The Poisson distribution takes a single rate parameter (in our example, this is the average goals scored per game) and gives back the probability of seeing 0 goals, 1 goal, 2 goals, and so on. So, if we assume the xG totals are equivalent to the average goals per game for that match (given the team’s performance on the day), then we can simulate match outcomes using the Poisson distribution.
We can then feed the simulated scorelines into the Dixon-Coles model, with the probability as the weight. In this way, we can get a model that predicts matches in terms of real goals, trained using xG totals.
What are the downsides?
- You lose xG-per-shot information. Even when the total xG is the same it’s generally better to take high-quality shots (which the best teams generally do). The xG-totals method presented here lacks any information about the distribution of xG across shots. This makes the model perform worse when making predictions (more on this in a second).
- In the proposed model, we don’t actually need to go through the Poisson simulations to get the exact same result. The whole problem simplifies down to a simpler regression problem. There might be some benefit to doing everything through a common framework (it certainly made backtesting it easier for me). I think the main benefit of talking about this is to further our intuition of how these models works.
- The scoreline simulation assumes independence of home and away goals (which is not true in reality). The xG-resimulation approach has the same issue, but it’s worth being aware of. You can sort of get around this somewhat by “transplanting” the dependence parameter (
) from a “real” D-C model, but it is a hack. Short of designing a better class of model, that might be the best you can do. Let me know if you have any better ideas on this front.
What is the performance difference?
Exactly how much worse does the model perform compared to the xG-resimulation approach (i.e. without the xG per shot information)?
As before, I ran a backtest to evaluate model performance. In a backtest, we train each model for each matchday in the past. We then make predictions using those models and see how well they would have performed, using the information they had available at the time. The following chart shows the backtest results for the English Premier League between 2016/17 and 2020/21, inclusive.
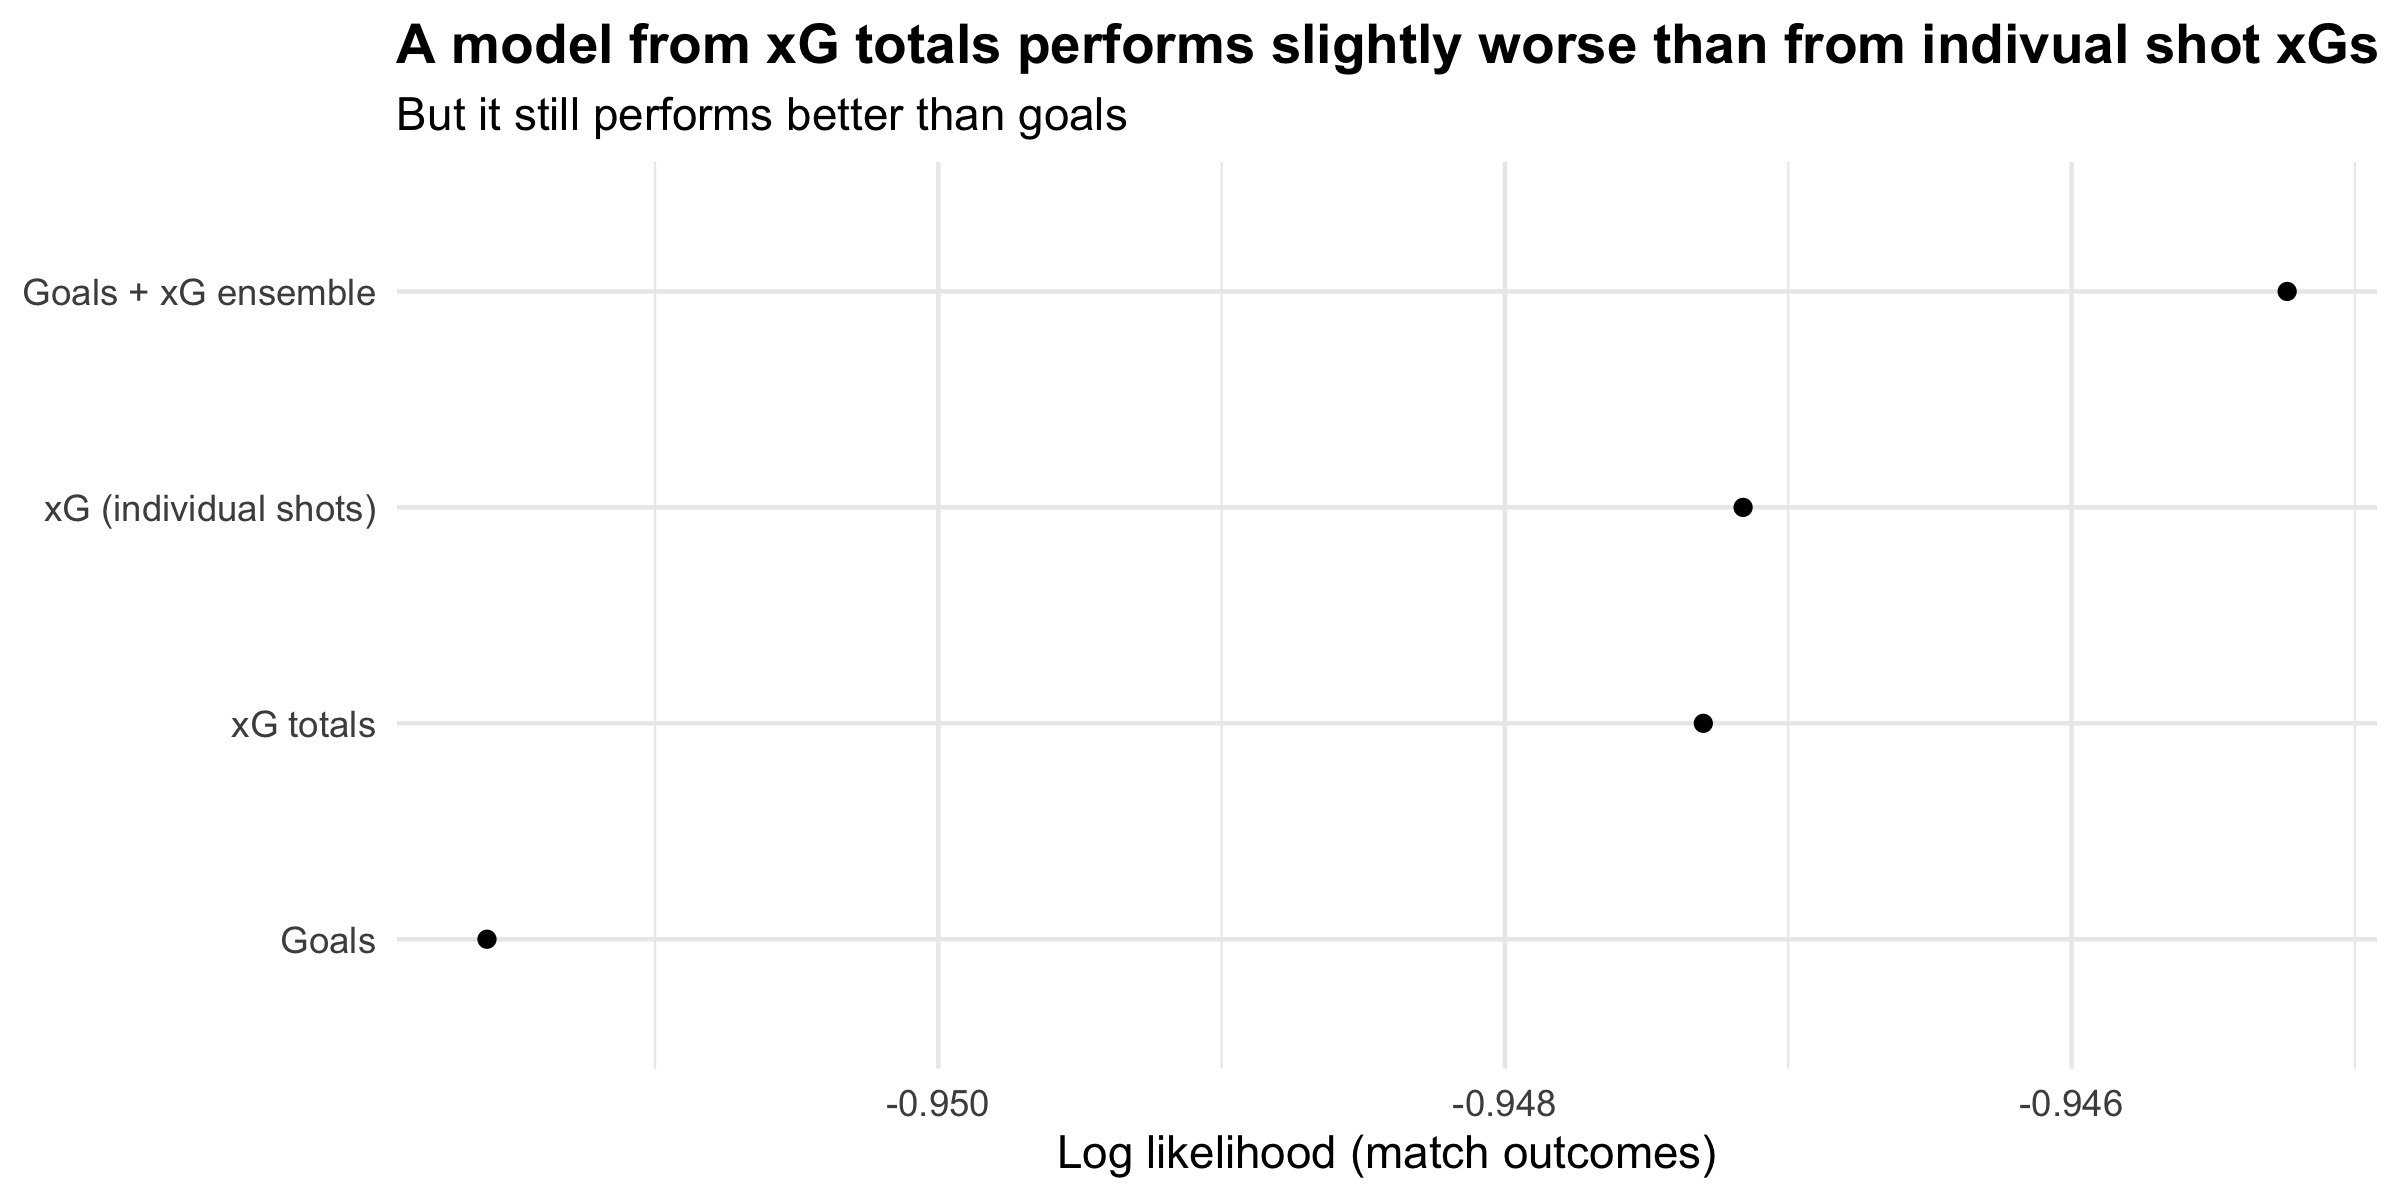
When looking at outcomes (home/draw/away), the totals-only model performs very slightly worse than the model with full xG-resimulations. This makes sense; it has access to less information about teams’ shooting patterns. However, it still performs a lot better than using goals.
Interestingly, the xG-totals approach performs much worse relatively on total goals than on per-match goal difference. For each match prediction, I took each model’s average predicted home and away goals. I then calculated total goals (home + away) and goal difference (home - away). Over the whole backtest dataset, I took the mean squared error for these two quantities.
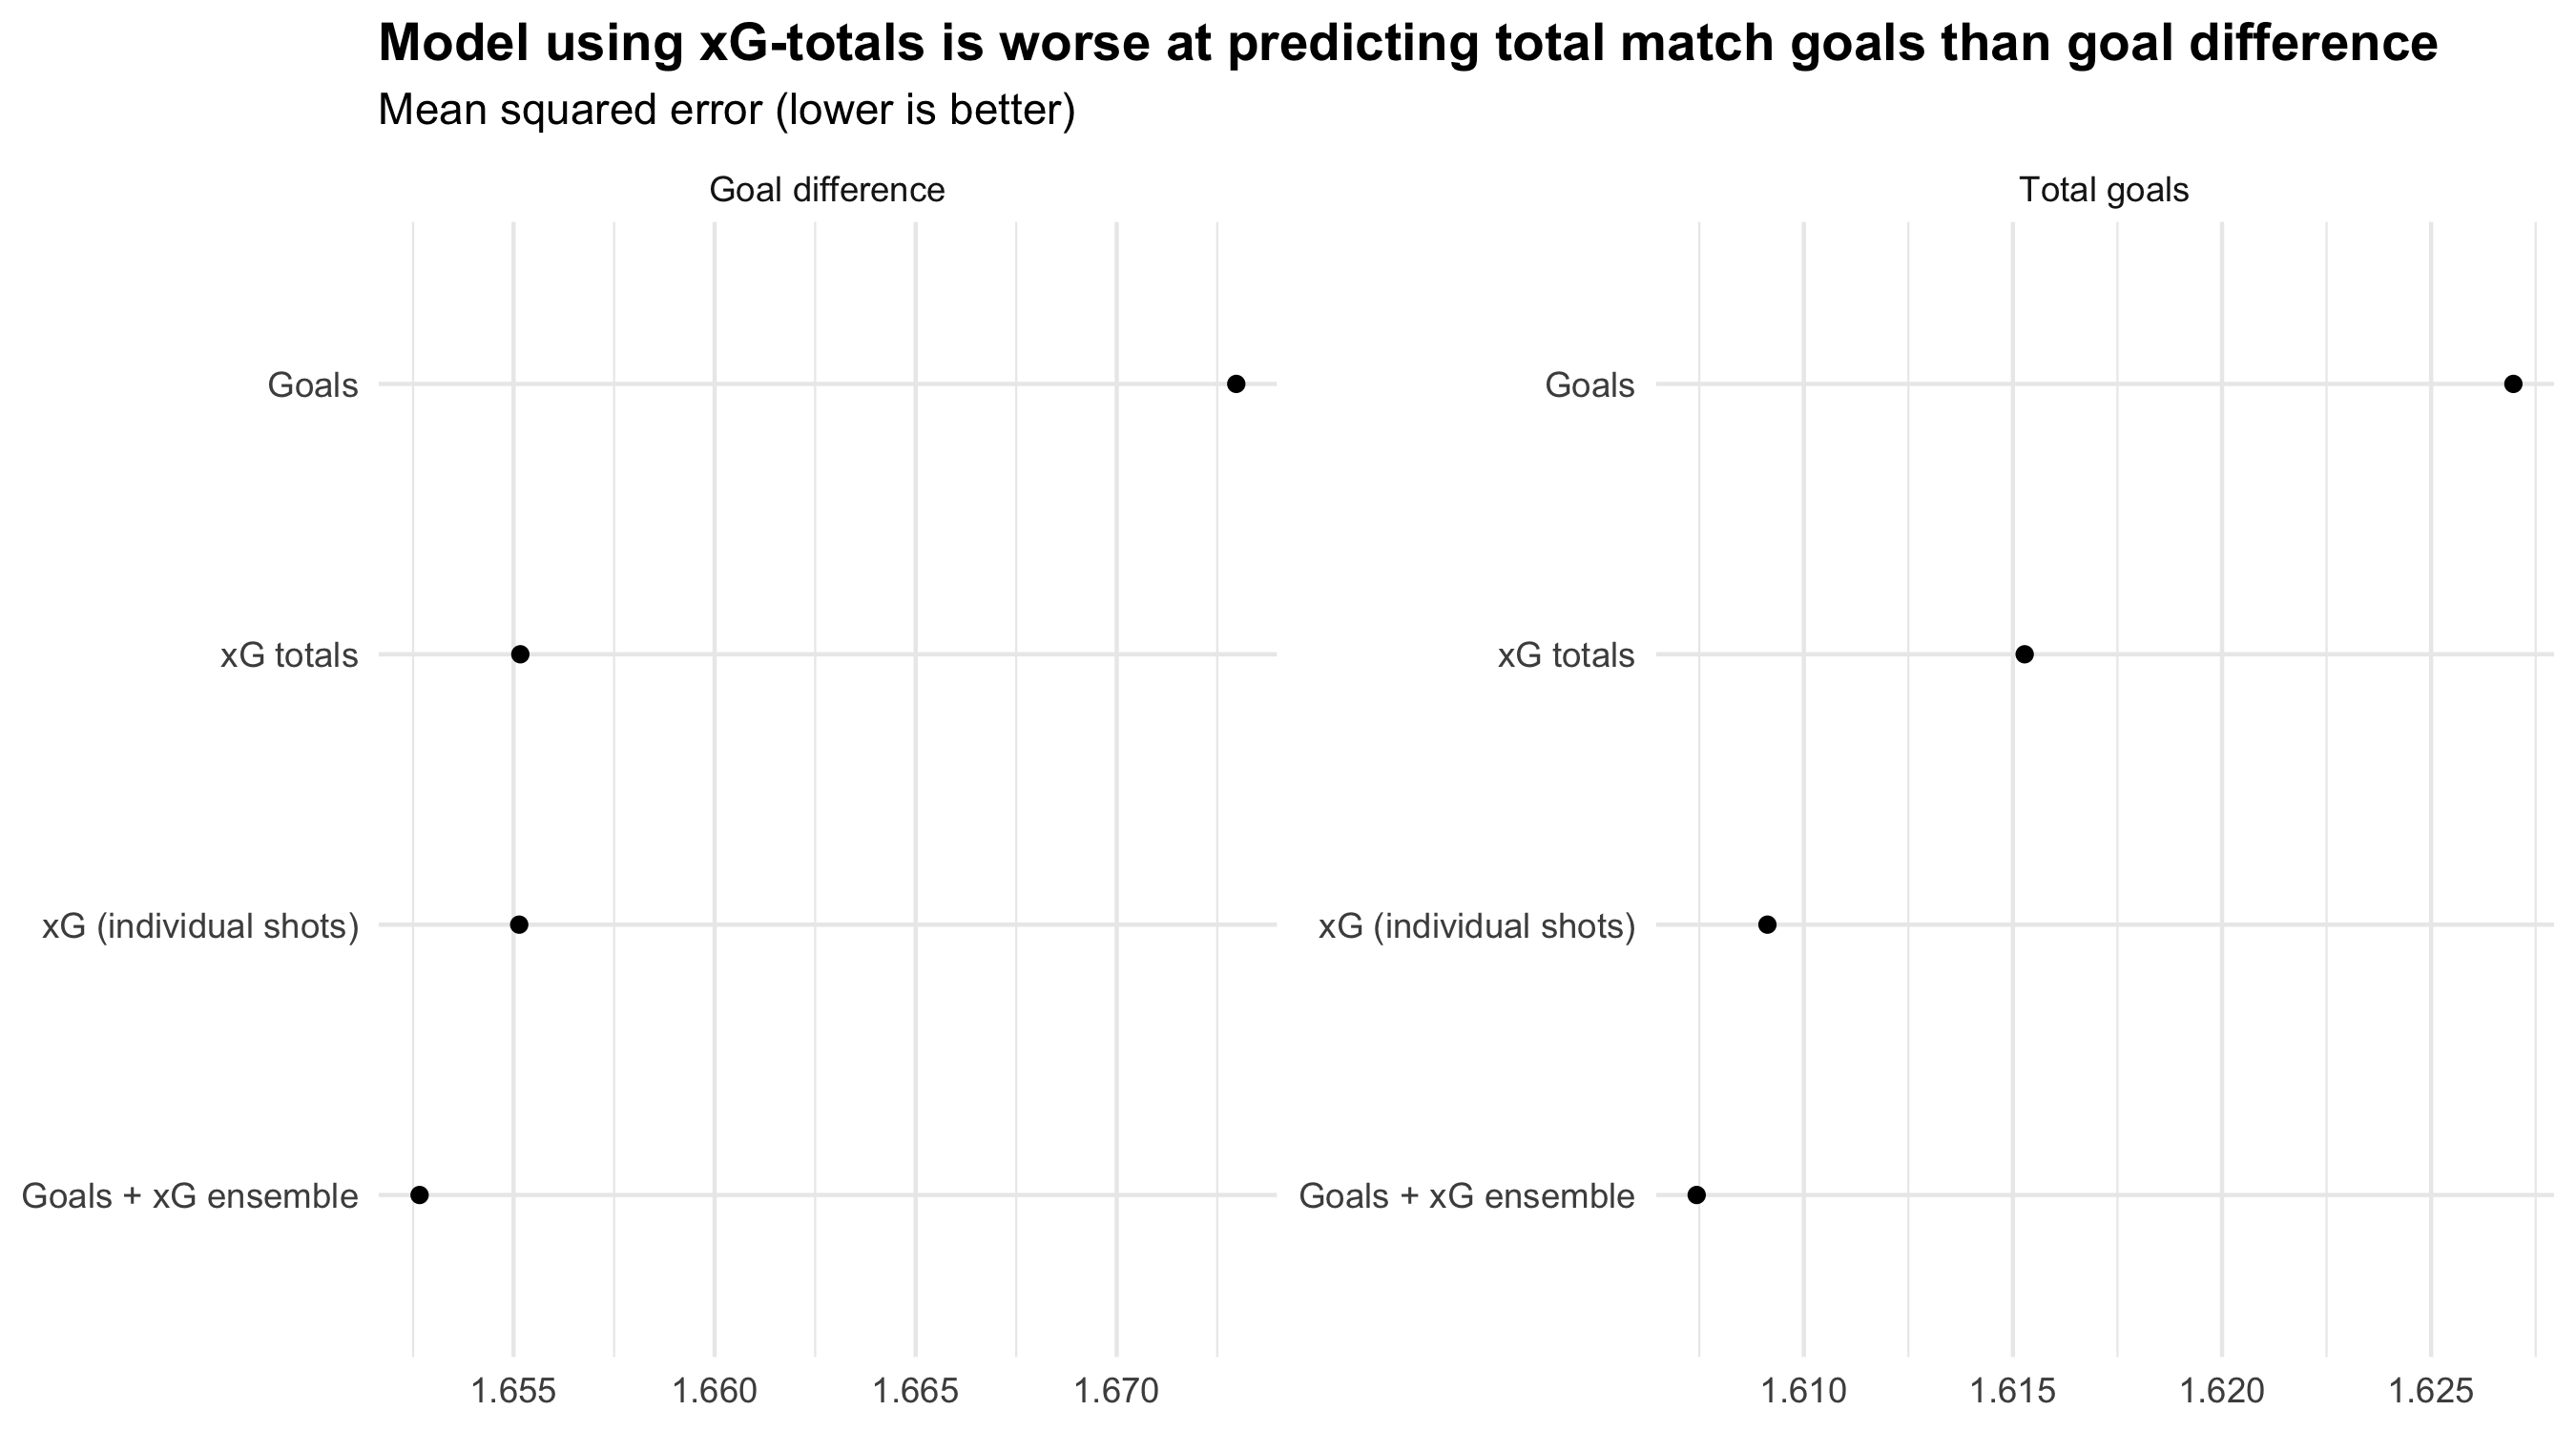
The xG-totals model performs almost exactly as well as the xG-resimulation model in predicting match goal difference. However, it performs markedly worse on total goals predictions (still much better than the goals-based model).
This suggests that the xG-totals method almost as good at estimating the relative strength of each team as the xG-resimulation approach. However, it is worse at predicting match outcomes because of some bias introduced; the xG-totals will underestimate the total number of goals being scored in any given match.
My hunch is that you could reduce some of this underperformance by using the number of shots in a game (also widely available) to get a mean xG per shot value. You could then use this xG per shot with the number of shots to simulate the match outcomes as though you had the individual shot data.
You could also gain some extra performance by ensembling a xG-totals model with a Goals model.
But at the end of the day, if this kind of performance drop is a big issue for you, it’s probably worth investing in a model with better foundations.
Conclusion
- You can make decent team strength models using only xG totals (but its predictions are not as good as with individual shot xGs)
- You don’t need the Dixon-Coles framework to do this (but it can be useful to have a common basis for comparison and model ensembles)
- You can apply this framework to incorporate many different data sets or information sources into a match prediction model. You just need a weighted-scoreline generation function.
Code etc
If you would like to reproduce this analysis, or dig a bit more into the technical details, the code can be found in my wingback repository.
This repo is built on top of understat-db, a project for pulling data from Understat.com into a database. It uses a Python library called mezzala for modelling team-strengths and match predictions.
I still have some Liverpool 2019/20 “data scarves” left for sale (shipping to the UK). If football+data is your thing, take a look
This is something I’ve touched on before, and I think there’s a lot of potential for incorporating different data sources, like non-shot xG, post-shot xG, betting odds, and so on, into the model. ↩︎