How much do Newcastle need to improve in January?
Right now, Newcastle are in an unusual position. They sit close to the bottom of the table and look like one of the favourites to get relegated. However, following their recent takeover by the sovereign wealth fund of Saudi Arabia, they have the ability to spend vast sums of money in January, and a season in the Championship would be damaging to the PIF’s sportswashing project.
So, exactly how much do Newcastle need to improve to have a fighting chance of remaining in the Premier League?
What are Newcastle’s current relegation chances?
At the time of writing, things look pretty grim for Newcastle. Based on current form, 538 give them a 75% chance of going down. Using the combined xG-and-goals model described here, we get a similar estimate of around 80%.
Of course, Newcastle are much better placed than their rivals to improve their team. With a new coach and an effectively limitless pile of cash, anything is possible… right?
The betting markets seem to think so. Odds on Betfair’s exchange give Newcastle an implied relegation chance of around 45%, significantly lower than the models.
Estimating relegation chance
To understand how team quality impacts relegation chance, we need to look at how I estimated Newcastle’s current, “naive” relegation chance.
First, I used a model to estimate the attacking and defensive strength of each team in the Premier League, based on both their expected goals for and against and their actual goals scored and conceded. I have written a few posts on these types of models if you are interested in more details on how exactly they estimate those strengths.
At the time of writing, the estimates for each team’s ability is like so:
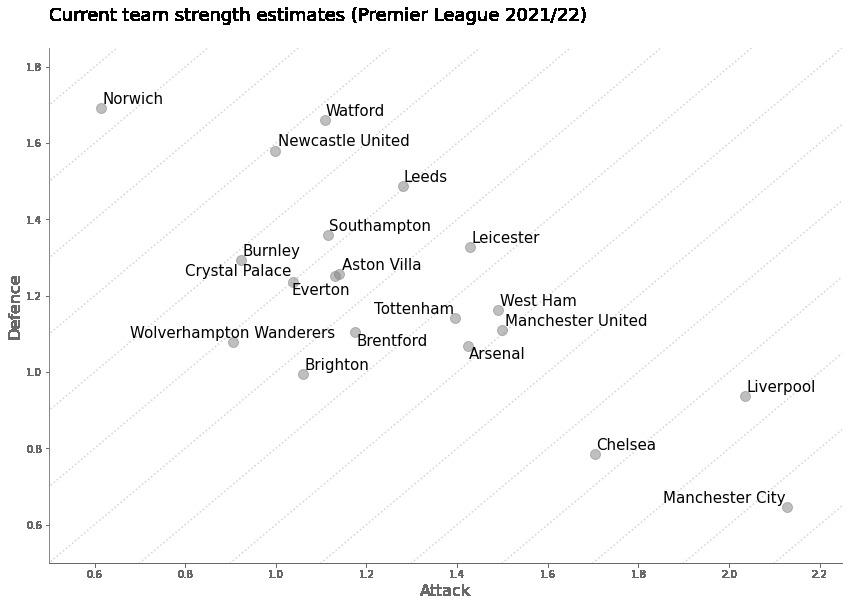
The axes refer to each team’s predicted goals (for/against) per game when playing against a hypothetical league average team, without home advantage.
Newcastle aren’t in a great spot. They’re estimated to score about 1.0 and concede 1.6 goals per game against an average Premier League side.
Using these estimates, we make predictions for each unplayed match in the rest of the season. For example, the model might predict that Brentford vs Leeds has a 5% of ending 0-0, a 6% chance of ending 0-1, … and so on for each possible scoreline.
With the predictions, we can simulate the remainder of the season by picking a random scoreline for each unplayed match, based on how likely that scoreline is to occur. Taking both the played matches and the simulated matches, we can work out what the table would look like at the end of this simulated season.
To get the relegation probability, we simulate the rest of the season over and over again and find the proportion of simulations that ended with Newcastle in the bottom 3.
How does team improvement affect relegation chances?
To understand how much Newcastle might need to improve (or how much the betting markets think they’ll improve), we can use the above method, but with a twist.
Instead of just estimating the relegation probability for Newcastle’s current ability, we estimate the relegation chance for Newcastle at a range of different abilities. In other words, before making the predictions, we modify Newcastle’s attack and defence estimates. This creates a set of “what if” scenarios, with associated relegation probabilities.
With this, we can see the probability of relegation at a range of different team strengths. The following heatmap shows the estimated probability of relegation if Newcastle played the rest of the season at a given level.
I have overlaid the current team strength estimates for all teams for context. Although, it should be noted that the colour of the heatmap at each point doesn’t refer to that team’s relegation chance. Rather it refers to the relegation chance that Newcastle would have if they instantly became as good as that team.
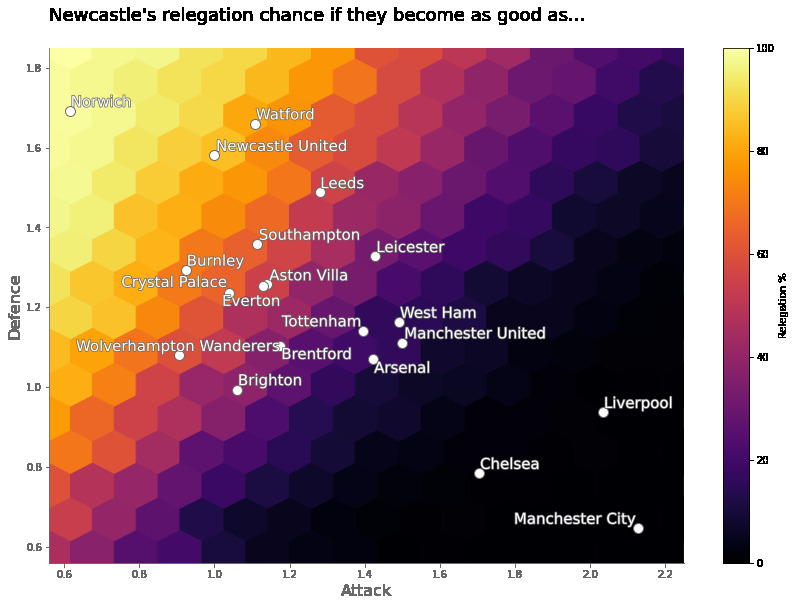
So, if Newcastle managed to become as good as Manchester City tomorrow, we would expect them to have almost no chance of being relegated. If they became as good as Arsenal or Tottenham, it would be more like 10-20%.
Betfair’s estimate of 45% puts implies an improvement in January to somewhere around the level of Aston Villa or Wolves. That would put Newcastle at an improvement of around 0.4 goals per game better in defence, and 0.1 goals per game better in attack.
Or, a (roughly) 0.5 GD per game improvement.
In the heatmap, the colour gradient is arranged diagonally. This implies that goal difference per game is more important to performance than the specific value of the team’s attack or defence.
Wolves, Southampton, Everton and Leeds all have similar associated relegation probabilities in the chart above. This is because their estimated goal difference per game is very similar, even though they achieve this through very different means. Wolves have solid defence but a poor attack. Leeds have a decent attack but a poor defence.
Some caveats
This method of season simulation is quite crude, and the resulting estimates are approximate. I can think of a few caveats which might shift the perception of the challenge facing Newcastle one way or another:
New signings require time to gel and learn systems. The simulation method assumes that the change to Newcastle’s ability will be instant. But if there’s an adjustment period for new players, the team will actually need to overshoot in terms of player talent in order to get an average performance akin to the target. To get Leicester-quality performance over the rest of the season, you might need to bring in players slightly better than Leicester’s to account for the new signings settling in and gelling.
Eddie Howe has only been head coach for a short while. The model is unlikely to fully account for any improvement to the team since his arrival, so the current estimate of Newcastle’s ability (and therefore relegation chance) might be a little pessimistic.
The competition simulation assumes all other teams will remain at their current level. This is clearly untrue. Other teams could get better or worse throughout the season. New signings, injuries, and motivation will affect teams.
How might this impact decision making?
Having numerical estimates gives you a feel for the scale of the challenge that Newcastle are up against. According to this model, improving the team to Arsenal/West Ham/Tottenham’s level leaves you with a 10-20% relegation chance. Even after such a huge increase in quality, there’s still a very realistic chance of relegation.
With this in mind, I would argue that laying foundations that will function in either the Premier League or the Championship would be a better strategy than going all-out for Premier League survival. Crystal Palace’s last 2 years are an excellent example of good decision- and deal-making in the face of uncertainty. Brighton, Brentford and Wolves have also shown that it’s possible to build a competitive Premier League squad in the Championship.
Having a rough idea of the relationship between improvement (in GD per game) relegation chance helps plan how to minimise relegation chance. For example, if you can think you can attract players who improve the team by around 0.1 GD per game over the course of the season (compared to their counterparts), then you’d need to sign 4-5 of these players to get to 40-50% chance of relegation. To get down to 15-20%, that would be around 8 players.
We already saw that improving the defence has a similar effect to improving the attack. This should give decision-makers confidence to focus on whichever area they believe is easier to improve.
Decisions and strategy are hard, especially when the stakes are so high. Having empirical methods like this can help focus decisions and reduce the risk of mistakes, making them a valuable part of an executives’ toolkit.
Code for this analysis is available on GitHub.